Network Gateway Case Study
Jaydev Gusani
Overview
The Network Gateway is a lightweight internal dashboard designed to give a product team immediate visibility into services running on a Kubernetes-based development environment.
Before its introduction, access to internal tools relied on scattered bookmarks and manual URL entry.
The Gateway replaces this fragmented workflow with a single interface that prioritizes clarity, speed, and
reliability under real-world usage conditions.
System context & Problem
The system operated on a single-master Kubernetes cluster, with services such as Meilisearch, NATS, and Kroki exposed across multiple ports.
In practice, this created a fragmented access pattern.
Engineers frequently relied on memory or ad-hoc
communication to locate services, leading to repeated context switching and small but constant
interruptions.
The problem was not a lack of infrastructure capability, but a lack of legible access.
The goal was to introduce a thin interface layer that made system state and entry points immediately obvious, without adding operational complexity.
Architecture & Performance
The dashboard was designed as a fully static, client-side application served via Nginx.
This decision
ensured that the interface remained available even if other internal services degraded, treating visibility
itself as critical infrastructure.
Instead of introducing a backend layer, the system queries Prometheus directly using PromQL.
This keeps
the architecture minimal while still providing near real-time telemetry (CPU, memory, network).
Avoiding frameworks and runtime dependencies reduced both load time and long-term maintenance overhead, aligning with the goal of building a durable internal tool rather than a feature-heavy application.
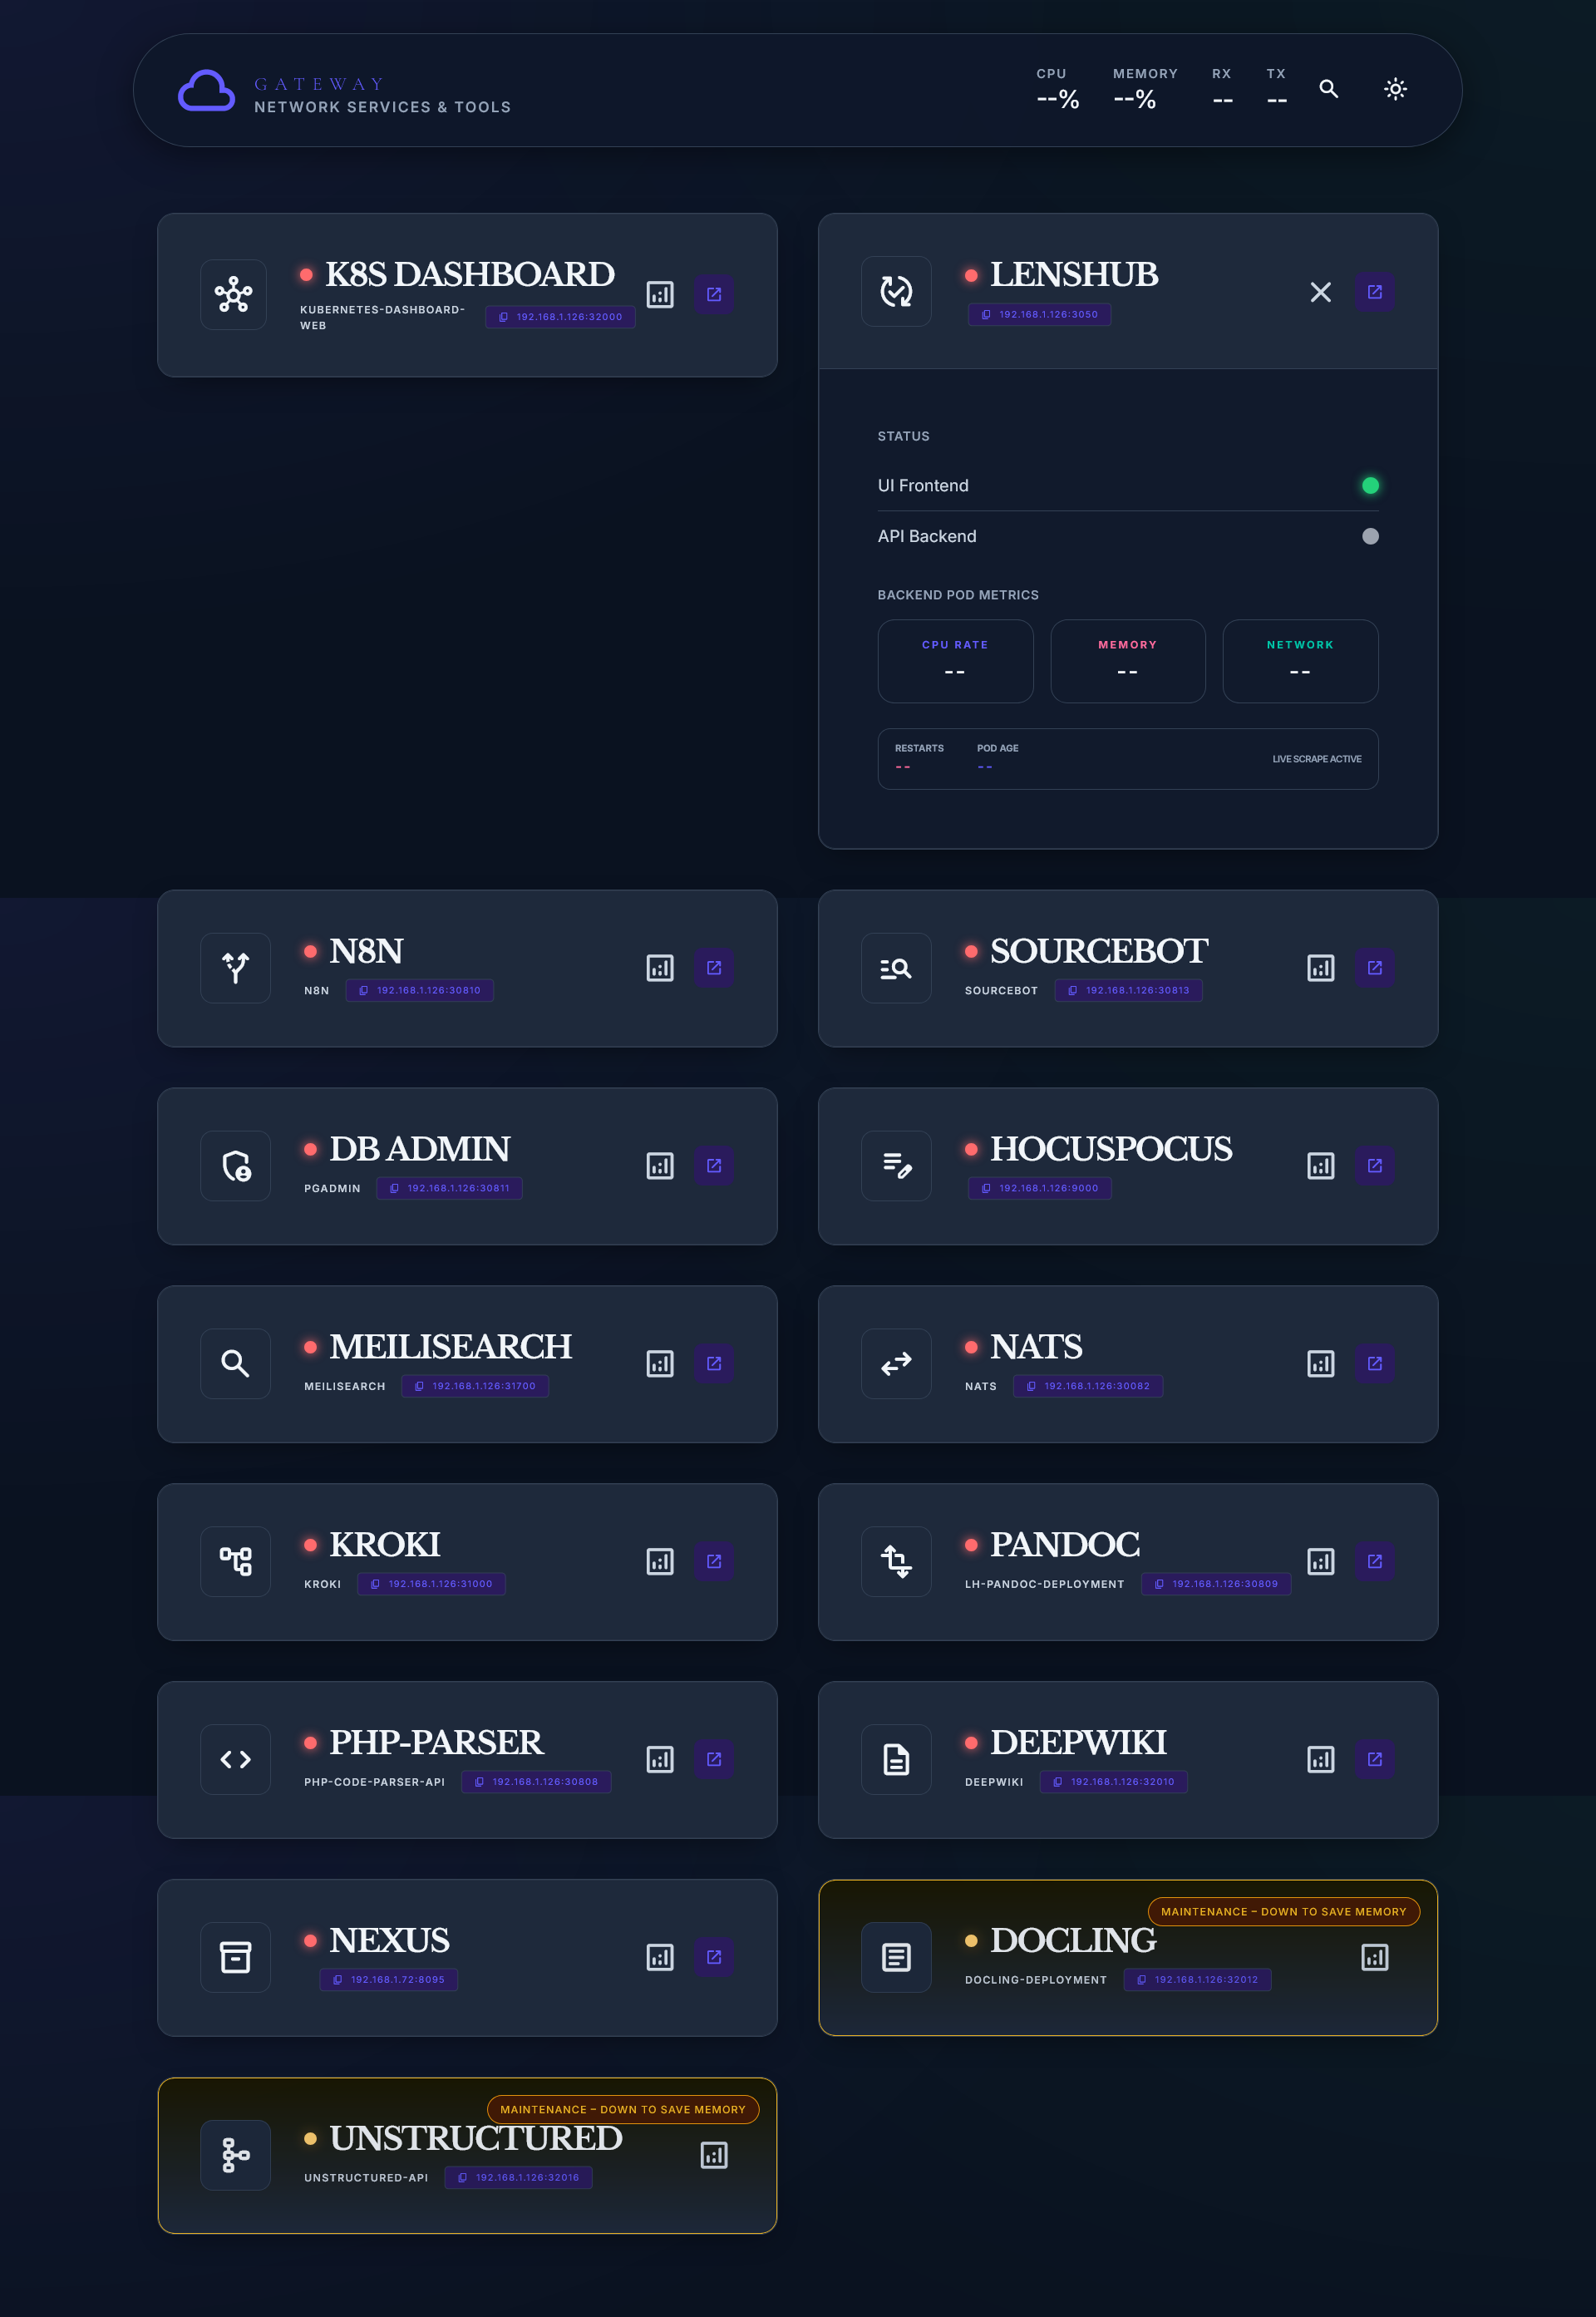
Interface Design
The interface is structured around Progressive Disclosure.
Service cards present high-level status by default, allowing quick scanning under time pressure. Detailed metrics and pod-level information are revealed only when needed, preventing cognitive overload during routine use.
A deliberate addition was the Maintenance State (amber badges), which allows intentional downtime to be explicitly communicated (e.g., “Down to save memory”). This reduces false alarms and replaces implicit team knowledge with visible system state.
The design treats the interface not as a control surface, but as a layer between system complexity and human understanding.
Outcome
The dashboard became the default entry point for the entire team, including the CEO and lead developer.
By consolidating service access and exposing real-time system state, it reduced reliance on tribal knowledge and minimized interruptions between team members. What was previously a scattered, memory-driven workflow became a consistent and self-serve interface.
System Ownership
This project spans two separate environments: an internal service layer and an external publishing layer.
The internal system is deployed within a LAN environment.
The dashboard is served via Nginx as a static interface, providing access to services running on a k3s
cluster.
Each service exposed through the Gateway is containerized and deployed within the cluster.
The underlying infrastructure, including the virtual machine and cluster setup is maintained directly.
The external layer is independent.
This case study is written and served through a custom-built platform (Protokoll), deployed on an edge network.
There are no managed platforms or third-party abstractions involved in the core system.
Both environments are designed, implemented, and maintained within the same boundary of authorship.
Tradeoffs
The system prioritizes simplicity and availability over extensibility.
By keeping the dashboard fully static and avoiding a backend layer, the interface remains reliable even
under partial system failure.
However, this limits dynamic interactions and deeper control capabilities
within the UI.
Direct querying of Prometheus removes the need for an intermediary service, but introduces tighter coupling between the interface and metric schema.
The system is intentionally restricted to a LAN environment.
This improves control and reduces
exposure, but prevents remote access without additional networking layers.
Future Updates
Future refinements will focus on improving the accuracy and clarity of system state.
The current health check logic is response-based, treating any reachable service as available.
This
will be extended to incorporate explicit health endpoints and Kubernetes-native signals, allowing status to
reflect the condition of underlying pods rather than simple availability.
Interface readability will also be refined.
The goal is to improve scanning under load, ensuring
critical information remains immediately legible as the number of services increases.